
the first 10,000 years
The First 10,000 Years is a collaboration with Gary, part of his larger body of work on the catastrophe insurance industry. The whole project is called FUD, named for both the bitcoin-speculator acronym ‘Fear, Uncertainty and Doubt’, and for its sonic qualities. The First 10,000 years simulates a market-simulation – a 10,000 year model – that serves as the backbone of a speculative trading platform and forum.
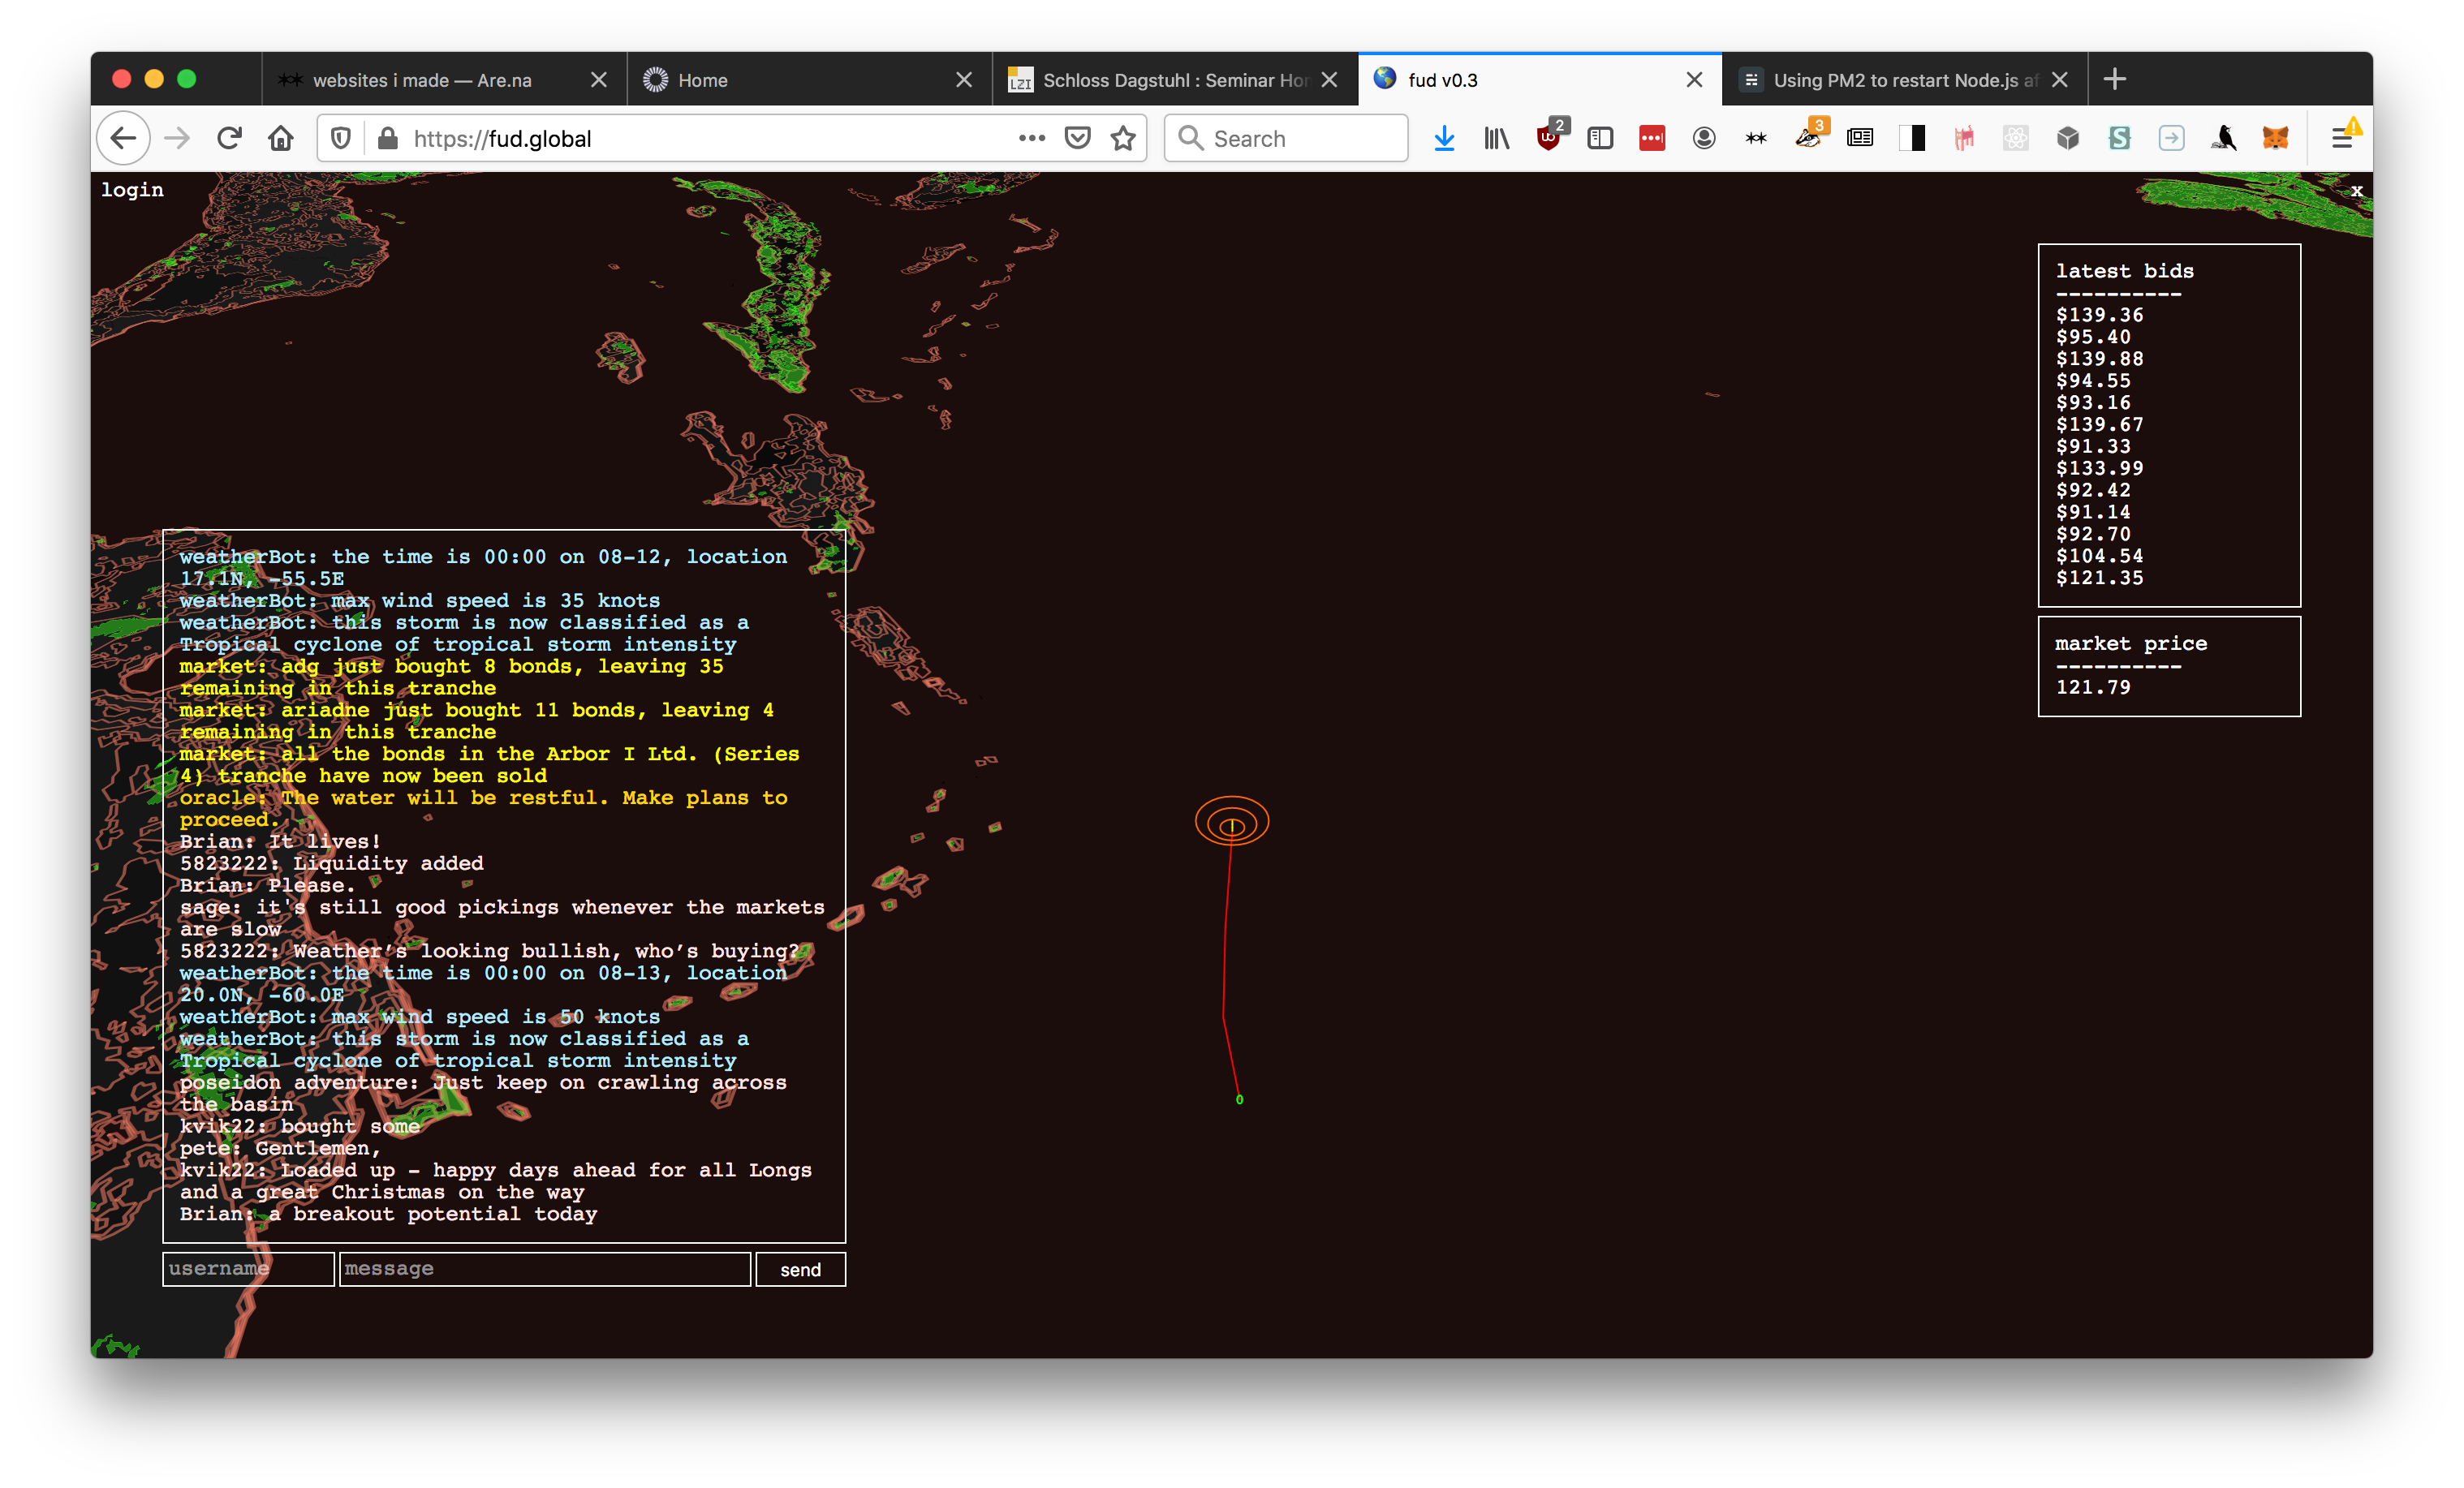
It’s still a work in progress, and I’m currently circling back to a second version and wanted to write down my thoughts. We ended up making the first iteration over the course of about a week, and it’s more of a sketch of what’s possible than a full simulation in it’s own right. As such, this post is about these small, basic component models that with a bit of love will flourish into real, functional objects.
the first 10,000 years
The catastrophe insurance industry sets its prices every year by running so-called 10,000 year models – using past data, along with statistical perturbation, to run the same year 10,000 times over, and calculate the average losses they can expect from various weather events. Of late, this form of simualtion is being forced to radically shift: climate change means that ‘all bets are off’ when it comes to the use of past data – but the industry has also been slow to change, in part due to the sheer complexity of the undertaking.
risk model
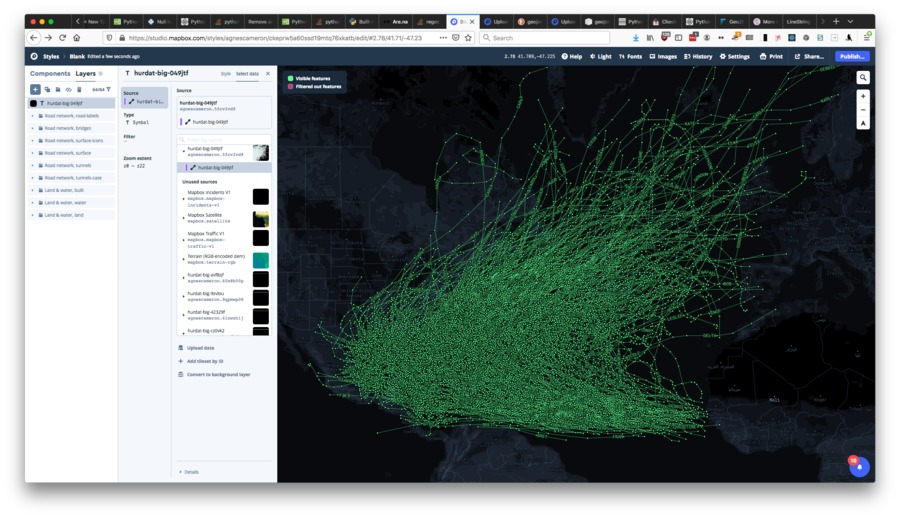
 putting the HURDAT data into Mapbox to map historical hurricane traces
In order to create our own 10,000 year model, we used the HURDAT dataset – a record of all the hurricanes to hit the Atlantic and East Pacific oceans, since 1851 and 1949 respectively. We truncated the dataset to use only hurricanes where there was a record of the intensity, and location at each stage – about half-a-century’s worth in total – and used this as the basis for our model.
Early on, we realised that we’d either need a much more expensive Digital Ocean server, or find another way to calculate the statistical perturbations on each hurricane, the likely damage to adjacent urban centers, and the changes in risk associated with each step, at the same time as handling the other aspects of the simulation. In the end, we decided to precompute the outputs of the model for the duration of the simulation, though there is probably a more graceful way to do this computation that wouldn’t have been quite so intensive. This also allowed us to normalise the outputs to help calibrate the market.
This pre-computation for each hurricane consists of an array of GeoJSON objects for each step, showing the risk, and the proximity to urban centers.
          "properties": {
            "class": "TS",
            "date": "11-07-1981",
            "highest_risk": "Nassau",
            "landfall": false,
            "proximity": [
              {
                "country": "bs",
                "distance": 427.51290613937533,
                "lat": 25.0833333,
                "lon": -77.35,
                "name": "Nassau",
                "pop": 227936.0,
                "region": "23",
                "risk_factor": 0.007291133730685746
              },
              {
                "country": "cu",
                "distance": 460.22906271772723,
                "lat": 20.887222199999997,
                "lon": -76.2630556,
                "name": "Holgu\u00edn",
                "pop": 319114.0,
                "region": "12",
                "risk_factor": 0.005600581696239157
              }
            ],
            "report": "Tropical cyclone of tropical storm intensity",
            "risk": 0.007291133730685746,
            "speed": "40",
            "time": "00:00"
          },
          "type": "Feature"
        }
As it stands, the model first takes each historical hurricane in turn, and modulates the density and path of the hurricane along a normal distribution, appending these to a list of possible hurricanes. Using these ‘possible hurricanes’, the model then calculates the proximity to and the intensity of the hurricane at each step, using a database of urban centers and a simple half-circle radius distance to estimate the risk to each city in the path. The financial risk is then modelled based on these factors, plus the population of each city: a crude metric, and one that we could certainly improve upon. These get appended to a database, along with the names and locations of the nearby towns, allowing them to be marked on the map and discussed in the chat.
If the hurricane broaches a distance of 2km, it is assumed to have ‘hit’ – and whatever value was tied up in various bonds is then lost, changing the state of the market.
The main things to change about this part is making the risk model a whole lot more sophisticated: instead of just using the distance, using proper Polygons with something like turf or geopandas would make things a lot more interesting (also maybe allowing them to be layered on the projections, dashboard-style).
Another strand is to actually employ some ML on actual losses associated with these hurricanes, which is much closer to how the hedge funds are doing it.
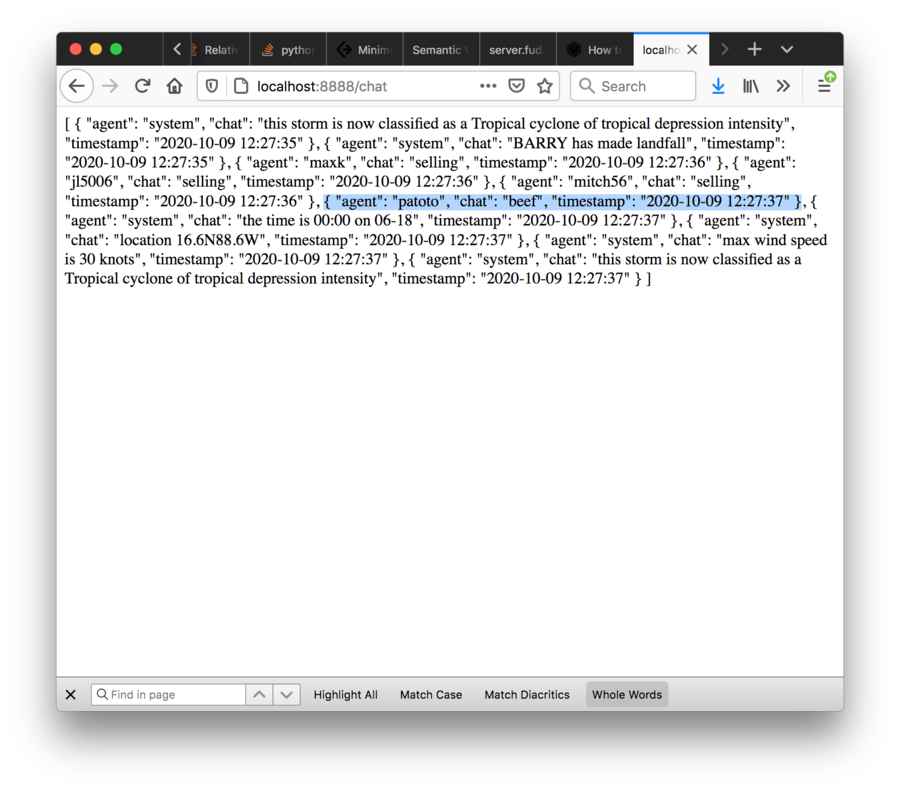
dialog models
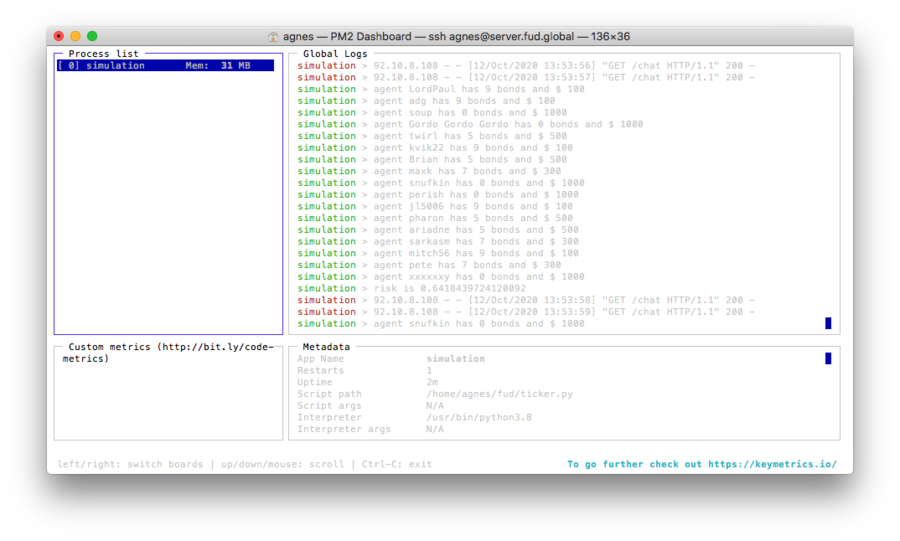 monitoring the chat log and simulation state on the server (we ended up using the PM2 process manager)
These are dumb right now but they could be much smarter. Currently, the dialog operates in 3 kind of ‘wheels’, or degrees of immediacy and involvement.
One suggestion Dan had was to have the chat itself be the trading interface, with agents making trades – a bit like the image of the Starship Bistromath in the Hitchhiker’s Guide to the Galaxy, where the ship navigates on the basis of complex interactions between diners and waiters in a bistro. It’s an idea I’d really like to return to, but the time constraints of the project meant that, at least for the moment, we were constrained to
Setting up a tiny IRC was immediately really exciting. At the very start, it was just a http endpoint, and my friend Dan and I spent half an hour just chatting using cURL. Even now, when I see a stranger in the chat screen it’s strangely thrilling. Perhaps it’s just nostalgia but there’s a kind of danger to it… you could say anything or be anyone… I guess this is why people like 4chan.
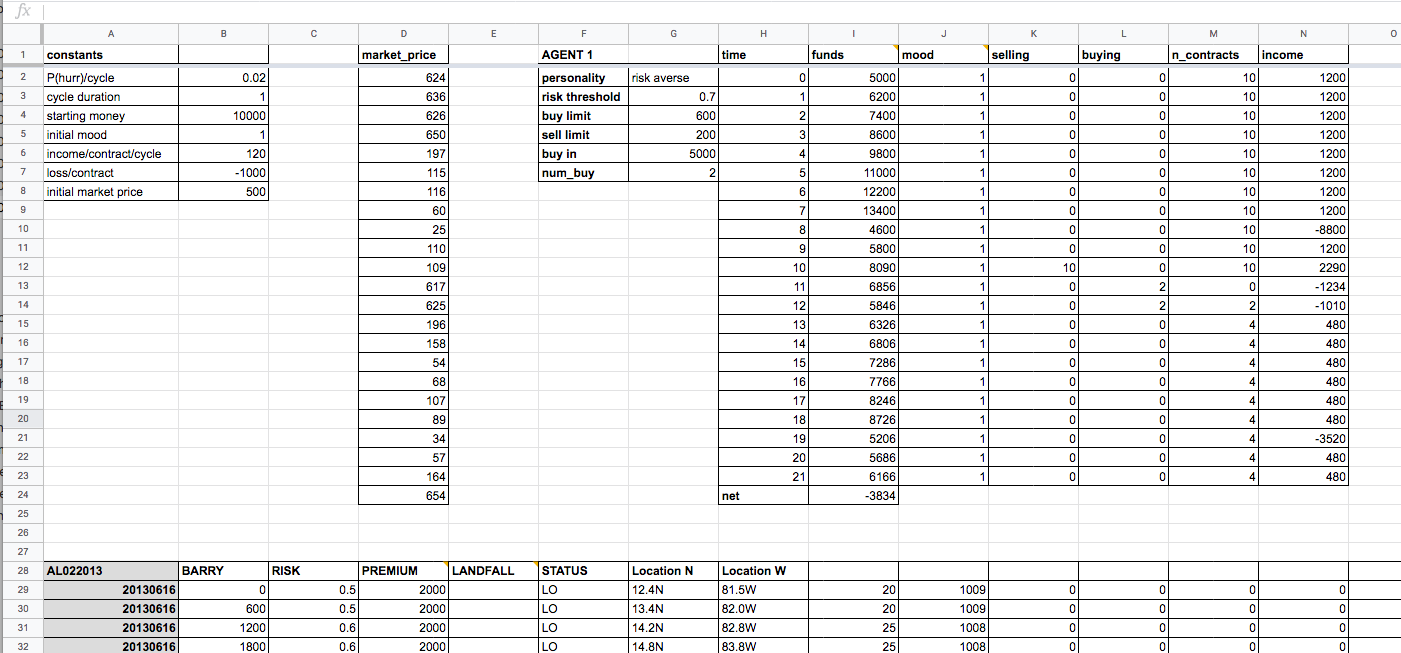
market
The market is in some ways the core ‘point’ of the simulation, populated by the agents shitposting on the forum trading bonds on hurricanes.
We started off modelling the market in a Google sheet, working out how we thought each agent should interact with the system. We wanted to give each one a basic personality and risk tolerance, which would, using a normal distrubution, define certain thresholds of risk which would modulate the price they were prepared to pay for a bond.
The sheet was really useful for getting a handle on that idea of what’s ‘interesting’ in a simulation – e.g. how to set the prices so there’s constant dynamism, rather than immediately tending towards one stable state or another.
Getting to the edge of our knowledge of Google Sheets formulas, we started to prototype in Python directly – starting with a simple buy/sell threshold, and moving to a more complex price-setting plus statistical distribution.
Each new hurricane, a tranche of insurance bonds are sold by a reinsurance fund, which in turn are bought up by different agents in the market. These in turn are cycled between agents in a series of bids as the risk changes, and each provides a return per unit time.
class Bond:
	def __init__(self, initial_price, bond_yield, period, company):
		self.initial_price = initial_price
		self.price = initial_price
		self.bond_yield = bond_yield
		self.bond_period = period
		self.company = company

	def yield_per_unit_time(self):
		return (self.bond_yield*self.initial_price)/self.bond_period

	def est_return(self, time_remaining):
		est = ((self.initial_price - self.price) + (time_remaining*self.bond_yield*self.initial_price)/self.bond_period)/self.price + 1
		return est

	def update_price(self, p):
		self.price = round(p, 2)
It’s financially prudent for agents to buy low and sell high, of course, but also to hold onto each bond as long as possible for the estimated return.
Bidding takes place each cycle, where agents make first bids dependent on whether they want to buy, and asks depending on whether they want to sell.
Agents are constructed internally with variable amounts of eagerness and desperation, which are recalculated each cyle, and which depend both on the normally-distrubted risk tolerance posessed by each agent, and on the profit or loss they’ve made over time.
In this sense, the market is not really a market – agents make bids based on their own internal state and then the market evens it out in terms of buys and sells. This acts as a proxy: in reality the agents look at the other bids that are being made and then make their trades based on that.
This is probably the part of the simulation I’m most interested in developing further, and using this more as a core mechanic to drive the other elements.